
A
Ming Dynasty Map
By Haoyu Shi
-- Measuring the Distortion between An Old map and A New Map
Map credit to https://www.loc.gov/resource/g7820m.gct00125/?sp=2
Introduction
The map above is a Ming Dynasty map created in 1547, showing the North Metropolitan Area of Ming Dynasty China (1368-1644). In that period, Spain, England, and other European countries began to travel overseas. Thus we can find maps written in Spanish and English during the sailing era. However, all these maps all show the world from a Western perspective. How is the world viewed from a Non-Westerner's point of view? What technologies did people use to measure the land? This map was created long before the invention of chronometer. Will the map be distorted? In this map, many places still exist today. (I was born and raised in Beijing, where is not only the capital of China now but also used to be the capital of Ming Dynasty). I will compare The Map of The North Metropolitan Area with OpenStreetMap to show the distortion of this Ming Dynasty Map.
Information of this Ming Dynasty map
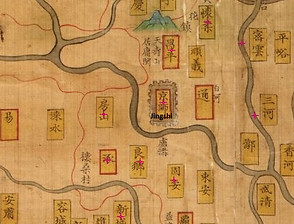
The map above is the Map of the North Metropolitan Area (北直隸與圖) which is one page of Atlas of the Ming Empire (大明與地圖) created and published in 1547. Atlas of the Ming Empire contains 1 page of the Map of the Entire Ming Dynasty and 18 pages of maps showing provinces. All the maps point top as north correctly. However, only the first page of the Atlas of the Ming Empire (see the map on the left), is drawn with a grid system. Each grid represents 500 Chinese miles (1 Chinese mile in Ming Dynasty ≈ 554 meters). However, since the maps are not designed mainly for navigation, on other pages of the Atlas of the Ming Empire, there is no legend to show the scale. Other than that, there is even no road showing on the maps. Those maps were mainly used for displaying the vast territory of Ming Dynasty and marking towns, cities, and provinces in a hierarchical way. Each city or town is labeled in a yellow box. The capital of Ming Dynasty, Jingshi (京師) (modern day Beijing), and other major cities have red frames, whereas small towns do not, and some villages even do not have a yellow box.

Atlas of the Ming Empire (大明與地圖)
Other than showing provinces and cities in a hierarchical order, the Map of the North Metropolitan Area depicts walls in details. It shows Jingshi surrounded by walls and shows the entire Great Wall (see the picture on the right).

Jingshi and The Great Wall
Information of OpenStreetMap
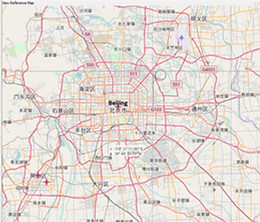
OpenStreetMap (OSM) is a modern digital map of the world that allows people to edit. The creation and growth of OSM has been motivated by restrictions on use or availability of map information across much of the world, and the advent of inexpensive portable satellite navigation devices. Thus, OpenStreetMap shows streets, water, and buildings in details.
Measuring Distortion between the Old Map and the New Map
In the Map of the North Metropolitan Area, many places still exist today. Even the names did not change in 500 years. Thus I link all the places that have the same names in the two maps. However, some places changed their name. I search their names on the internet. For example, Jingshi (京師) changes its name to Beijing (北京) (see pictures below).
However, some places share the same name, but they are not at the same position. I eliminate those points. Also, there are some villages along rivers. It is hard to determine which side of the river the villages locate. Thus, I put the points in the river. For example, in the old map, Sanhe (三河) and Miyun(密雲) are on the east bank of River Ji (蓟运河), but on the new map, Sanhe and Miyun are on the west band of River Ji (see the pictures below).


Other than picking the places labeled on the old map, I also pick up the river entrance to the sea and the Great Wall as reference points. Since the North Metropolitan Area is a triangle shape, I linked as many points as I can in the half of the rectangle map. Though there are only a few places labeled in mountain areas (the north-west part of the North Metropolitan Area), and the rivers depict so differently from the old map to the new map, I linked the points in the plain area as many as I can and make them distribute evenly in the plain, so the measurement will be more accurate. At last, I choose 56 pairs of places and calculate the map distortion as the picture shown below.

Displacements and Distortion of the Old Map Compared to the New Map

Isolines for Distortion and Displacements
After linking all the points, MapAnalyst calculates the scale of the old map is 1:1,544,800, and the rotation is 5° [cw]. The standard deviation for the old map is ± 18,951 m and the mean position error is ± 26,801 m. However, since the North Metropolitan Area is a triangle shape, we cannot find any reference points on the other half of the map. The results here under exaggerate the actual standard deviation and the mean position error for the old map. The old map is considerably distorted, and all the points displace from the old map to the new map. The most distortions and displacements occur near the coastline. Tianjin(天津) and Laolongtou(老龍頭) have the most significant displacement. Those two points are considered as outliers (the displacement is bigger than three times of the standard deviation). And I am sure that I did not mark a wrong place because Tianjin is a port and Laolongtou is the intersection of the Great Wall and the coastline (see the picture below). We can find the exact position on both maps. Also, there are considerably high distortion in mountain areas.


Laolongtou, the Intersection of the Great Wall and the Costline
Credit: http://citylife.house.sina.com.cn/detail.php?gid=32977
Tianjin Port on Google Earth
Tianjin and Laolongtou on the Old Map
Disccussion
Why the old map has so many distortion and displacements? Why the most distortions and displacements occurs along the coastline? First of all, in 1547, there was no accurate chronometer, so that people could not calculate the accurate longitude. Thus, when creating a large map, people usually got the wrong longitude. This makes measuring inaccurately. For the places along the coastline, the coastline changed during these 500 years. Even the coast varies from high tide to low tide. And for those places in mountain areas, since the elevation is unstable, people have to do more calculations. Did they omit some important calculations? Also, different generalizing techniques may cause distortion and displacements. The map of the North Metropolitan Area does not show each town and cities in size or shape, it only labels boxes on the map, so it is hard to determine where the points actually are. In the ancient time of China, people depict the map not mainly for navigation but also for describing what they think and what they like. Maps are more than a tool for navigation.
References
The Atlas of the Ming Empire. [Da Ming yu di tu]. 大明與地图. Library of Congress. https://www.loc.gov/item/2002626776.
The Dragon's head and Sunset. [Xi yang Long tou].夕照龙头. Sina. http://citylife.house.sina.com.cn/detail.php?gid=32977.